

Result description
The Dynamic Exposure Visualisation Dashboard (DEV-D) shows people their exposure to air pollution when they are on the move. DEV-D displays information on trips recorded with a) mobile app DEVA and b) mobile sensors that people carry when travelling. If a user doesn’t have a sensor, DEV-D will use modelled data from Google’s BreezoMeter. DEV-D plots the recorded trips on a map and shows which parts of the journey are safe and dangerous by taking into account pollution concentration along the route, international pollution guidelines (WHO), as well as user’s personal characteristics, travel mode and intensity. DEV-D merges individual travel information with air quality data in a single interface to provide insight into people’s commuting habits, encouraging them to take healthier routes.
Addressing target audiences and expressing needs
- To raise awareness and possibly influence policy
- Grants and Subsidies
- Testers: people willing to use the app and provide feedback on its utility
- Investors: those who can fund further development and business growth
- Advisors: experts in business planning to advise on routes to market
- Promoters: organisations or individuals who can endorse and showcase the app in specific settings e.g. schools, universities, work places, public institutions
- Public or private funding institutions
- EU and Member State Policy-makers
- Other Actors who can help us fulfil our market potential
R&D, Technology and Innovation aspects
The DEV-D (Dynamic Exposure Visualisation Dashboard) underwent extensive refinement and debugging during field testing phases in Flanders and Berlin.
Over 750 kilometres were covered – primarily on foot and by bicycle – during the closed testing round to optimise the initial versions of both DEV-D and DEVA (Dynamic Exposure Visualisation App).
These efforts were further extended during the open testing round, during which additional debugging and fine-tuning were performed, informed by feedback from over 970 recorded trips. This open round involved a diverse array of stakeholders, including:
- Bicycle communities
- School children and educators after presentations and demonstrations in educational institutions
- Attendees at high-profile events, such as the VeloCity Conference (Ghent), where the DEVA-DEV-D integration was showcased
- Volunteering citizens, including local champions
- Subject-matter experts
- Civil servants
Significant technical improvements were implemented at multiple levels.
DEVA trip recorder and data manager
- Trip geometry refinement: The geometry of recorded trips was fine-tuned to manage outliers, thereby improving data granularity and accuracy
- Recording frequency adjustments: The recording frequency was adapted to suit different modes of travel (such as faster-moving vehicles), taking into account sensor limitations
- Sensor identification: The functionality for sensor ID scanning was enhanced
- Battery and bandwidth optimisation: Efficiency was improved through better management of power consumption and data bandwidth. Features like server connection optimisation, bundled data upload, and post-trip data transmission (e.g., via Wi-Fi) were introduced
- Network connectivity: Connectivity issues were investigated and optimised if possible
- Alert system: New alert messages and icons were introduced for real-time feedback
- Model integration: An analysis was conducted on how Google’s Breezometer model maps onto the recorded trip geometries, which provided insights into air quality exposure along the routes
DEVA trip recorder and DEV-D integration
- Data filtering and WHO guidelines: Data filtering functionalities were improved, incorporating references to WHO air quality guidelines
- User Interface (UI) and User Experience (UX): Usability testing led to improvements in the UI/UX, making the platform more user-friendly
- Graphical data visualisation: Visual representations of exposure data were enhanced, allowing for comparative analyses based on trip duration, distance, and absolute time
- Multinational testing: Field tests were conducted across various countries (UK, Austria, Spain, France, Germany, Italy, The Netherlands, Bulgaria, and Belgium)
- Environmental condition testing: The system was evaluated under a wide range of environmental conditions, including urban and rural areas, indoor/outdoor settings, weather variations, and different times of day
- Interactive inhaled dose graphs: Exposure metrics in DEV-D were expanded to include interactive inhaled dose visualisations, allowing users to input their gender, age, and activity level for more personalised results
- Black Carbon (BC) sensor testing: A limited set of tests incorporated Black Carbon sensors without internal GPS functionalities toward the end of the COMPAIR project
QADOS (formerly SODAQ) sensor
Feedback and data on air pollution collected during testing were shared with QADOS to inform further product optimisations. This feedback encompassed the usability and technical characteristics of the mobile air quality sensors mounted on bikes using a holder and attached to backpacks with silicone sleeves and clips.
Outcome and future potential
The culmination of the COMPAIR project is a well-calibrated and efficient toolset for monitoring air quality along travel routes using mobile sensors such as QADOS. Comprehensive user manuals have been developed for various configurations and use cases, enabling future adoption of the DEV-D and DEVA solutions for both policy-making and educational purposes.
With additional development and investment, new sensors could be integrated into the DEVA-DEV-D system. There is also significant potential for scaling the visualisation of modelled air quality data across Europe, which would allow air quality monitoring using just the DEV-D trip recorder, without the need for additional hardware.
Interested parties can request to have a custom DEV-D app built for them. This would involve a SaaS agreement with the following services
- Consultation and development: Understanding client needs and building custom dashboards or data management systems tailored to their project or organisation
- Data integration: Offering services for data migration, cleaning, and structuring to ensure smooth implementation
- Support and maintenance: Provide ongoing technical support, troubleshooting, system updates, performance monitoring, and other maintenance services
- Training: Provide training and documentation for teams to efficiently use the dashboard
DEV-D is licensed under GNU General Public License v3.0. This means that if people know how, they can recreate the dashboard from the code provided. GNU GPL3 is an open source licence that allows others to use it privately, even for commercial purposes.
If interested parties aren’t able to build the dashboard themselves, they can ask owners for help. In this case, ATC would build a custom DEV-D app upon request, in line with the GNU GPL3 licence, and under the SaaS principles.
Result submitted to Horizon Results Platform by ATHENS TECHNOLOGY CENTER ANONYMI VIOMICHANIKI EMPORIKI KAI TECHNIKI ETAIREIA EFARMOGON YPSILIS TECHNOLOGIAS
 Please
  Get instant access to tailored funding opportunities that perfectly match your needs. This powerful feature is exclusively available to our premium members—helping you save time, stay ahead of the competition, and secure the right funding faster.
 Curious about who’s viewing your listings? Unlock insights into your last 20 visitors and discover potential leads instantly!
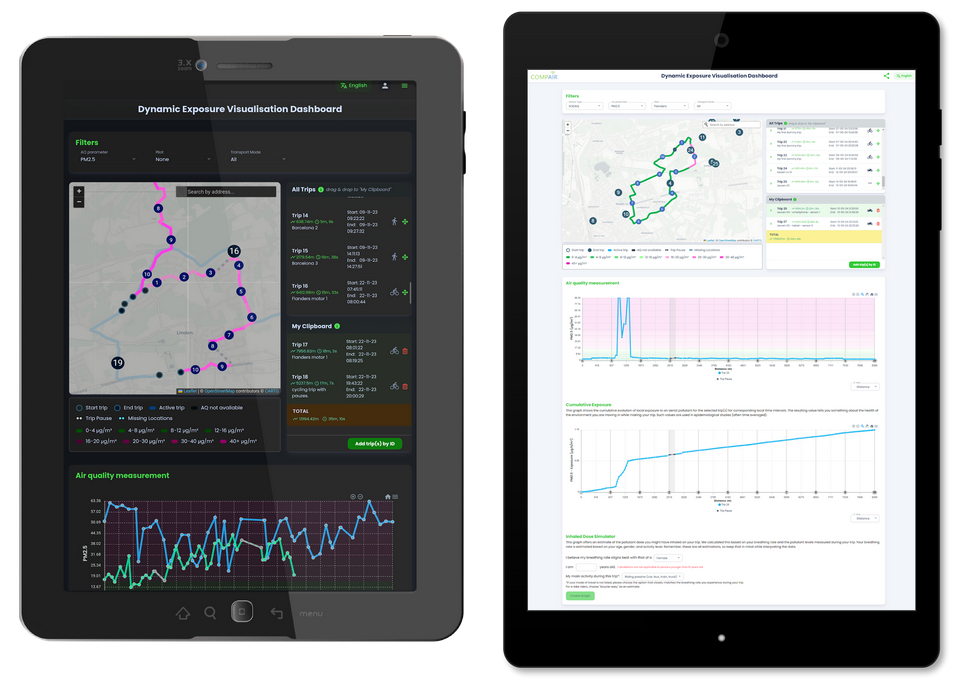